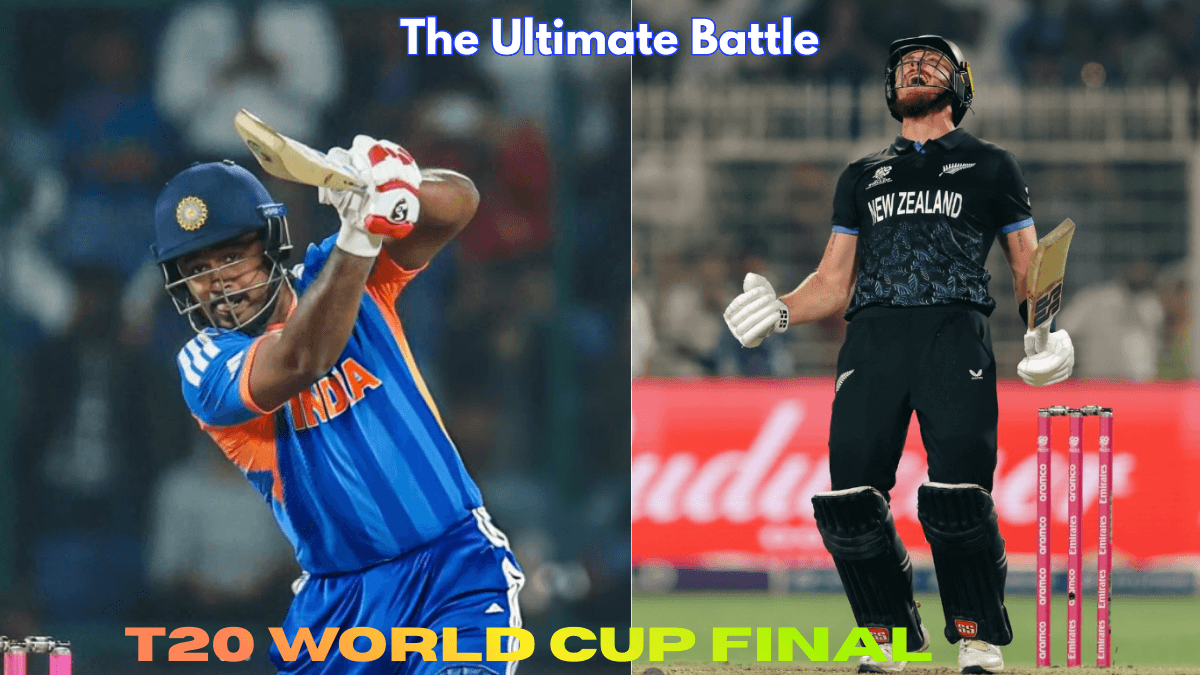
India vs New Zealand T20 World Cup Final 2026: Dream Final Set for a Thriller in Ahmedabad
Table of Contents
Kiwis Ready for Their Biggest Test: India vs New Zealand Both teams will play the final where they lost to South Africa.
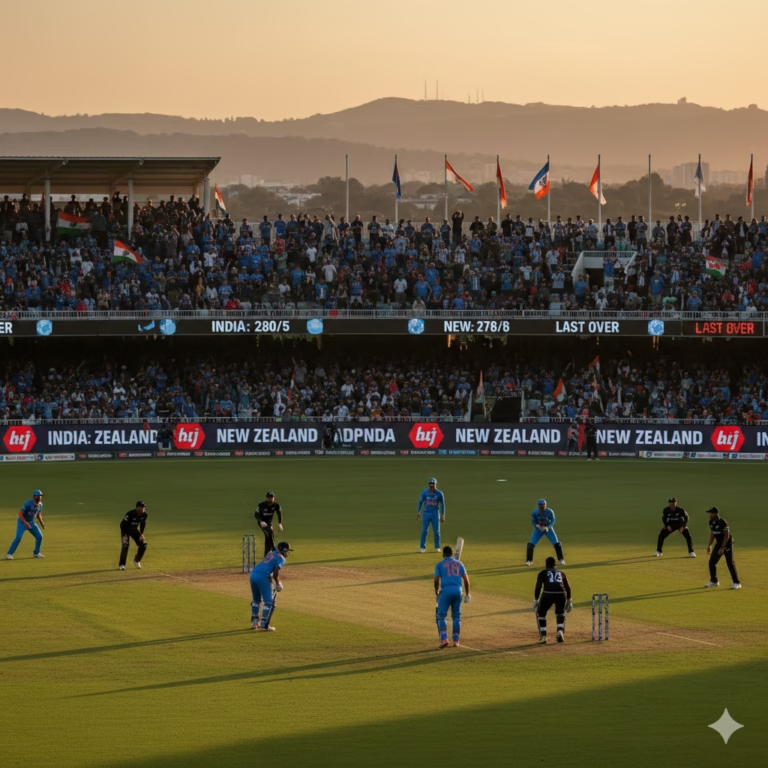
The T20 World Cup started on February 7 between 20 teams and now the top-2 teams will play the final match tomorrow in the world’s largest cricket stadium in Ahmedabad. This match of India vs New Zealand will be full of great entertainment and heart-thumping. Because both these teams have lost one match each here to South Africa in the Group C match.
Now the title challenge will be presented on this same ground. India has become champion twice in 2007 and 2024 and will now try hard to become champion for the third time, whereas New Zealand has not yet won the T20 trophy and has reached the final for the first time after 2021.
India vs New Zealand Head to Head
| India | Vs | New Zealand |
| 18 | Win | 11 |
| 11 | Lost | 18 |
| 1 | Tie | 1 |
| 0 | No Result | 0 |
| 60 | Win % | 36.67 |
Top Batter
| Abhishek Sharma | Vs | Tim Seifert |
| 182 | Total Runs | 425 |
| 45.5 | Batting Avg. | 32.69 |
| 249.31 | Batting SR | 148.60 |
| 84 | Highest Score | 84 |
Top Bowler
| Varun Chakravarthy | Vs | Jacob Duffy |
| 4 | Total Wickets | 7 |
| 32.75 | Bowling Avg. | 32 |
| 24 | Economy | 18.57 |
| 2/37 | Best Figure | 2/27 |
T20 world cup final Team batting record
| India | Stats | New Zealand |
| 1492 | Run | 1176 |
| 9.84 | Run Rate | 9.84 |
| 27.31 | Batting Avg. | 41.68 |
| 157.05 | Strike Rate | 160.87 |
| 9 | Fifty | 6 |
| 0 | Century | 1 |
| 11 | Duck | 2 |
| 128 | Four | 109 |
| 88 | Sixes | 57 |
| 256 | Best Score | 183 |
New Zealand spinners pose a threat to Indian batsmen
- New Zealand played 7 innings and took 41 wickets, out of which 18 were taken by spinners and the rest by pacers.
- On the other hand, Team India took 59 wickets in 8 innings, out of which 23 wickets were taken by spinners and the rest by pacers.
- New Zealand spinners conceded runs at an economy rate of 7.5, while India conceded runs at an economy rate of 8.3.
- New Zealand performed better than India in overall economy as well and Indian batsmen, especially Abhishek Sharma, give up their weapons against right arm spinners and so far, except for 2 matches, they have not been able to score more than 10 runs in the remaining 6 matches.

Team India is strong in the middle overs
Looking at the batting from different angles, Team India has lost two wickets in the power play while scoring an average of 58 runs. However, the team has also scored 80+ runs twice, but these scores were against smaller teams (Namibia, Zimbabwe).
The team was certainly strong between overs 7 and 16, losing three wickets while scoring an average of 93 runs. The team’s best score was 123 runs against England in the semi-final match.
Team India was weak in the death overs, with an average score of 44 runs in the last four overs, while an average of 50+ runs is common in the death overs.
The team could score 60+ runs only 3 times and could not reach the score of 70 even once.

New Zealand is very strong in power play
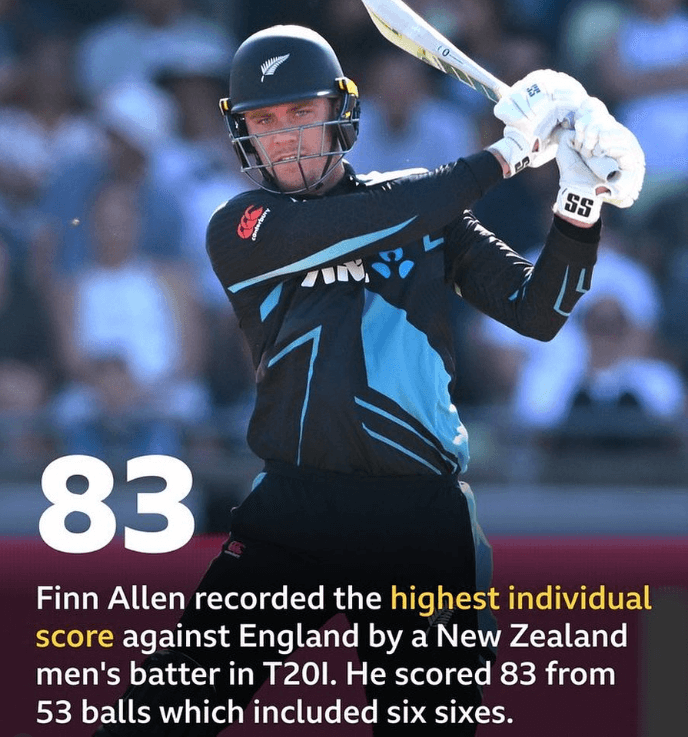
The T20 World Cup final between India vs New Zealand will be played tomorrow, and the Kiwi team is known for its stormy power play. If both openers Tim Seifert and Finn Allen are not dismissed in the initial overs, they can easily score 250+.
Chasing the target, both openers often made fifty partnerships and ended the match in the middle overs.
If Team India is to win the final, then all three New Zealand openers will have to be sent to the pavilion soon.
Narendra Modi Stadium Ahmedabad – T20 Record
| Record | Stats |
|---|---|
| Average Score | 200+ runs approx |
| Highest Team Total | 224+ runs |
| Highest Individual Score | 152* (Devon Conway) |
| Batting First Avg | ~246 |
| Batting Second Avg | ~217 |
The Ahmedabad pitch generally favors batting with high-scoring matches, but fast bowlers often get early swing under lights
India vs New Zealand Top Batters
Sanju Samson (India)- 4 match, 232 Run, 201.73 Stirke Rate, Best-97*
Ishan Kishan (India)- 8 match, 263 Run, 189.2 Stirke Rate, Best-77
Sanju Samson (India)- 8 match, 242 Run, 137.5 Stirke Rate, Best-84*
Fin Allen (New Zealand)- 8 match, 289 Run, 203.52 Stirke Rate, Best-100*
Tim Seifert (New Zealand)- 8 match, 274 Run, 161.17 Stirke Rate, Best-89*
Glenn Phillips (New Zealand)- 8 match, 176 Run, 160 Stirke Rate, Best-76*
India vs New Zealand Top Bowlers
Varun Chakravarty (India)- 8 match, 13 wickets, 8.85 Economy, Best-3/7
Jasprit Bumrah (India)- 8 match, 10 wickets, 6.62 Economy , Best-3/15
Hardik Pandya (India)- 8 match, 8 wickets, 8.79 Economy, Best-2/16
Rachin Ravindra (New Zealand)- 8 match, 11 wickets, 6.88 Economy, Best-4/27
Matt Henry (New Zealand)- 8 match, 09 wickets, 7.59 Economy, Best-2/3
Lockie Ferguson (New Zealand)- 8 match, 06 wickets, 8.42 Economy, Best-2/40
India vs New Zealand Strenght and weakness
India Strength– Jasprit Bumrah proved to be a game-changer in bowling, while Sanju Samson and Ishan Kishan proved to be game-changers in batting. All three players performed in positions where everyone else flopped. Apart from these, Hardik Pandya, Shivam Dubey, and Axar Patel are strengthening the team’s strength with their all-round performances.
India weakness-Varun Chakravarthy and Arshdeep Singh are proving to be very expensive, due to which the team is feeling the lack of a bowler. Abhishek Sharma and Surya, apart from scoring a fifty, have not been able to perform well and are also continuously dropping catches and misfielding. Both have a very poor strike rate.
New Zealand Strength-The opening pair of Finn Allen and Tim Seifert haven’t put much pressure on the rest of New Zealand’s batsmen. Henry maintains pressure with the new ball, while Ferguson doesn’t concede many runs in the middle and death overs. Santner and Nisham are finishing the innings well.
New Zealand weakness-The Kiwis’ middle order appeared weak, with Mitchell, Chapman, and Rachin Ravindra unable to maintain their scoring rate after Allen-Seifert and Phillips. The team has not scored 200+ runs in the tournament.